One way to study this case is through the numerical analysis of diffraction, as described in my other answer to you.
You can also do this pretty much as you describe through Huygens's principle or as Feynman describes in his popular QED book. If you set up an equation to describe what you've said, you'll see that the amplitude at a point with transverse co-ordinate $X$ on a screen at an axial distance $d$ from the plane with the knife edge is:
$$\psi(X) \approx\int\limits_0^\infty\exp\left(i\,k\,\sqrt{(X-x)^2+d^2}\right)\,{\rm d}\,x\tag 1$$
where the line of sources runs from $x=0$ to $w$ (the width of the bright region), where we can take $w\to+\infty$ if we like. We have neglected the dependence of the magnitude of the contribution from each source on the distance $\sqrt{(X-x)^2+d^2}$. This is because we now invoke an idea from the method of stationary phase, whereby only contributions from the integrand in the neighbourhood of the point $x=X$ where the integrand's phase is stationary will be important. Thus for $x\approx 0$ we can assume $|X-x|\ll d$ and so:
$$\psi(X) \approx\int\limits_0^w\exp\left(i\,k\,\frac{(X-x)^2}{2\,d}\right)\,{\rm d}\,x\tag 2$$
an integral which can be done in closed form:
$$\begin{array}{lcl}\psi(X) &\approx& \sqrt{\frac{2\,d}{k}}\displaystyle \int\limits_{\sqrt{\frac{k}{2\,d}}(X-w)}^{\sqrt{\frac{k}{2\,d}} X} e^{i\,u^2}\,{\rm d}\,u \\
&=& \sqrt{\frac{d}{2\,k}} e^{i\frac{\pi}{4}} \sqrt{\pi} \left({\rm Erf}\left(e^{3\,i\frac{\pi}{4}}\sqrt{\frac{k}{2\,d}}(x-w)\right)-{\rm Erf}\left(e^{3\,i\frac{\pi}{4}}\sqrt{\frac{k}{2\,d}}\, x\right)\right) \\
&=& \sqrt{\frac{d}{2\,k}} \left(C\left(\sqrt{\frac{k}{2\,d}} X\right) + i\,S\left(\sqrt{\frac{k}{2\,d}}X\right) -\right.\\
& & \qquad\left.\left(C\left(\sqrt{\frac{k}{2\,d}}(X-w)\right) + i\,S\left(\sqrt{\frac{k}{2\,d}}(X-w)\right)\right)\right)\end{array}\tag 3$$
where:
$$\begin{array}{lcl}
C(s) &=& \displaystyle \int\limits_0^s\, \cos(u^2)\,{\rm d}\,u\\
S(s) &=& \displaystyle \int\limits_0^s\, \sin(u^2)\,{\rm d}\,u\\
\end{array}\tag 4$$
where $C(s)$ and $S(s)$ are called the Fresnel integrals.
If I plot the squared magnitude of this function (related to the Fresnel integrals) in normalised units when $k=d=1$ and $L\to\infty$ (noting $C(\infty)=S(\infty) = -1/2$) for $X\in[-10,20]$ I get the following plot:

which I believe is exactly your plot with a shrunken horizontal axis (yours is likely mine with the transformation $x_S = 2\,\pi\,x_R$ where $x_S$ is Satwik's $x$-co-ordinate and $x_R$ Rod's).
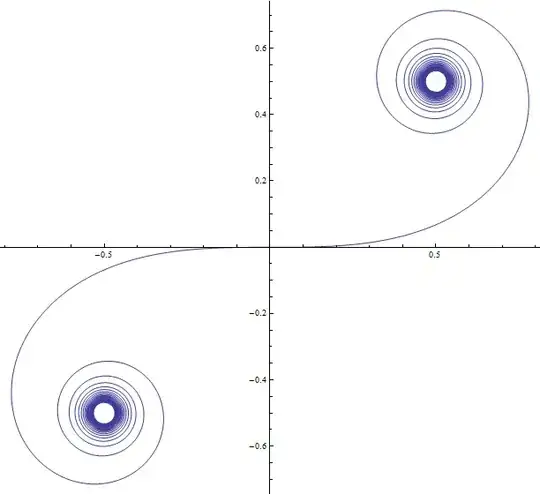
Footnote: One of the loveliest curves from eighteenth and nineteenth century mathematics is the Cornu Spiral, which is a special case of the Euler Spiral. $\psi(X)$ in (3) traces a path in the complex plane parametrised by $X$, which turns out to be the arc-length $s$ of the spiral path in $\mathbb{C}$ such that:
$$\begin{array}{lcl}x &=& {\rm Re}(\psi(s)) \propto C(s) + \frac{1}{2}\\
y &=& {\rm Im}(\psi(s)) \propto S(s) + \frac{1}{2}\end{array}\tag 4$$
and I plot the normalised and shifted path $z = C(s) + i\,S(s)$ I get the lovely spiral below. The curly bits spiral all the way in to $\pm(1+i)/2$ as $s\to\infty$. The shifting and then taking magnitude squared explains why the intensity plot above is not symmetric about $X=0$, oscillating as $X\to\infty$ and dwindling monotonically as $X\to-\infty$.